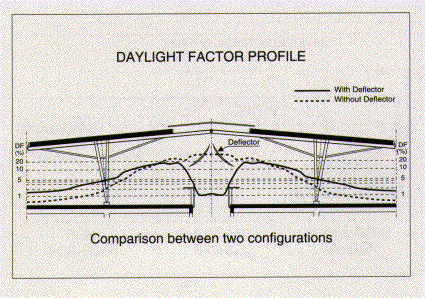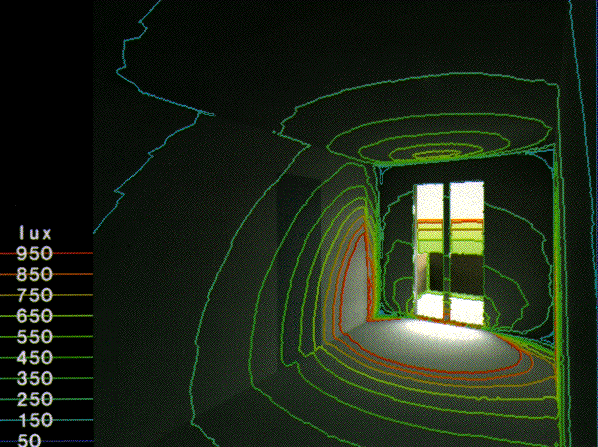

Light distribution can be displayed through either two or three dimensional graphics, and results are given as iso- lux or iso-daylight-factors curves.
Daylight savings time iso-curves can also be displayed.
Light penetration can be analysed through two dimentional sections of the building. It is very powerful for estimating the performance of the analysed system, and to see the respective influence of each opening.

3-D displays allow the designer to view the whole space from a selected point-of-view, and to clearly understand the way light enters the building.
Iso-lux curves are superimposed, in order to provide accurate information.
A 3-D display is also an efficient medium for the designer to communicate the "spirit" of his or her project, and to enhance the results of the lighting strategy he or she has developed.
 Webmaster contact information.
 Last changed: September 23, 1996 by webmaster ckehrlich@lbl.gov