Figure 12. The Image Analyzer (winimage) application allows you to display and post-process Radiance images. Image Analyzer is a stand-alone program that can be run separately from the rest of the Desktop Radiance AutoCAD plug-ins.
Note: There are two basic types of Radiance images (both with the .pic extension), ones that contain "real world" luminance values (also known as "raw" images) and those whose dynamic range has been compressed for display purposes. The "raw" images which come straight from the rendering engine contain the predicted "real-world" luminance or illuminance values as would be measured with a luminance or illuminance meter. These images can be altered in ways that either preserve or lose the underlying luminance values. A Radiance image that has been altered in some way (as with some of the operations supported by the Image Analyzer) retains the same appearance as its predecessor, but no longer contains the full dynamic range of the original "raw" image. The functions provided in the "Image" menu of the Image Analyzer application preserve the "real-world" luminance or illuminance values while the functions in the "Analysis" menu cause the image to loose the real-world values. It is meaningless to perform an "Analysis" menu command on an image produced through an "Analysis" menu command.
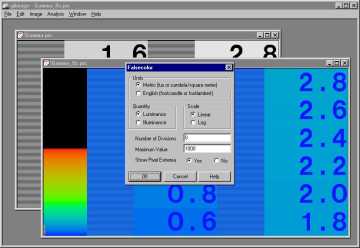
To adjust the exposure of the image to the average for the overall image while preserving the linear brightness mapping function, use the Image—> Exposure—> Image command. This will create an exposure that approximates the dynamic range of a printed photographic image. To generate an Iso-Lux or Iso-Candela plot of image illuminance or luminance values, use the Analysis—> Falsecolor… command. The resulting image no longer contains the actual luminance or illuminance values. The filename will be automatically renamed with a "_fls" extension.
To generate a representation of how the selected image will appear considering the sensitivity and adaptation of the human eye, you can use the Analysis—> Human Sensitivity—> Image command. The resulting image will show loss of visual acquity and loss of color saturation at low light levels, and will show veiling glare around bright windows. It will also adjust the overall image according to a human contrast sensitivity function to more closely mimic the human visual perception.
Note: The human sensitivity functions of the Image Analyzer are documented in the paper by Greg Ward called "A Visibility Matching Tone Reproduction Operator for High Dynamic Range Scenes" which can be viewed on the Internet at: http://radsite.lbl.gov/radiance/papers/index.html While highly useful for generating an impression of the limitations of the human visual system, the algorithms have not been rigorously validated and should be used with caution.
After performing some type of analyses, the results can be saved to .GIF, .BMP, .PICT (Macintosh), .EPS (gray-scale), or .TIFF file formats for printing. The File—> Save as… menu item provides you with the usual browse dialog to perform these operations.